How to Embed Charts on Your Website
So, you've made a beautiful chart with SnappyCharts, and you're ready to share it with the world. Embedding charts shouldn't feel like cracking a secret code regardless of whether you handcraft websites in a code editor, wrangle WordPress, or just want “copy, paste, done.”
Here's the lowdown on the two types of embeds SnappyCharts offers, plus step-by-step directions for your web-building scenario of choice.
The Two Ways to Embed (and Why You Should Care)
Snapshot Embed (free feature):
With snapshot embed, you get a chunk of code, including all the needed CDN scripts, ready for a good old-fashioned copy and paste. It's static: if you update your chart in SnappyCharts, you'll need to redo this copy-paste dance to get the latest version on your site.
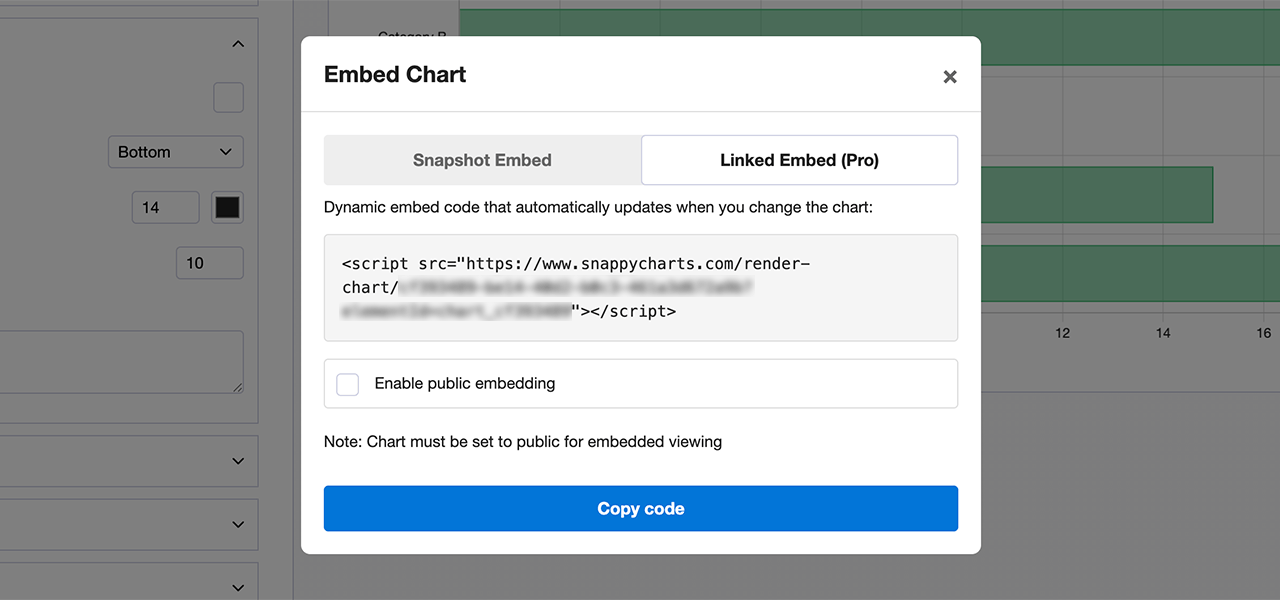
Linked Embed (pro feature):
This script tag always fetches the freshest version of your chart straight from the SnappyCharts server. Change your chart? Bam! Your website's chart updates automatically. This option is a pro feature, so you'll need to subscribe.
Getting the Embed Code (for Either Option)
- Open the chart you want to embed in SnappyCharts.
- Click the “Get embed code” button above your chart.
- Choose “Snapshot Embed” or “Linked Embed.”
- Click the Copy button.
- Now you've got the code, and you're ready to paste like a boss.
How to Embed in Different Scenarios
1. You're Code-Savvy and Have a Code Editor
- Paste your embed code directly where you want the chart to show up in your HTML.
- For static/snapshot, paste the full code snippet.
- For dynamic: just add the script tag to your page, and you're set.
- Refresh your site and admire your work.
- For static embeds, remember: copy and paste the code again if your chart changes.
2. WordPress (Block Editor / Gutenberg)
- In the block editor, add a Custom HTML block to your post or page.
- Paste your embed code into the block.
- Click “Preview” to make sure the chart appears.
- Publish/update your page.
3. WordPress (Classic Editor)
- Switch from “Visual” to “Text” (HTML) mode.
- Paste your embed code where you want the chart to live.
- Switch back if you want (just don't freak out if you see code—your chart will show up on the actual page).
- Save or update your post/page.
4. Website Builders (Wix, Squarespace, etc.)
- Find the “Embed Code” or “Custom Code” widget/block.
- Paste in your code.
- Save and preview.
- You might need to publish to actually see your chart live.
Tips & Gotchas
- Getting the size right?
The chart is placed in a container that will try to fill whatever space you give it. You can drop it into any design element on your site, and it'll fill the available space. - Multiple charts?
Paste each embed code where you want it, each is unique. - Snapshot embeds won't auto-update!
Just copy/paste in the updated version after your chart changes. - Linked embed not working?
Double-check your subscription, ensure the chart is set to public, and verify that external scripts are allowed by your hosting provider (ask your IT if your site has a content security policy / CSP header and if so, have them add snappycharts.com). - When in doubt, reload.
And that's it! Charts were embedded, the audience dazzled, and tech headaches were successfully avoided.